Bloomberg Businessweek:
Smartest Spenders in Sports --
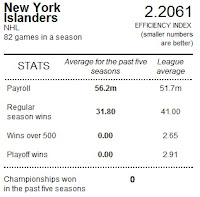
Behold our second annual ranking of how well the 122 franchises in the NFL, NBA, NHL, and MLB spend their money. We’ve used payroll data (from USA Today, Basketball-Reference.com, NBC Sports, and NFL.com) to calculate how much teams spent per win over the last five seasons. (For baseball, we also include the first half of the current season.) We then compared every team against league average, producing a total score we call the efficiency index. The median score for every league is zero. The lower the score, the less a team spent for its wins.
This year, we’ve added bonuses for the victories that matter most: wins above .500, playoff wins, and championships. Our scale counts regular season wins once, with a half-win bonus for every win over .500. Playoff wins count for 10 percent of a season; championships for half a season. In their Super Bowl winning season in 2011, for instance, the New York Giants got credit for 9 regular season wins, plus a .5 game bonus for their ninth win—the one that put them above .500. Their 4 playoff wins earned them 6.4 more wins. And the Super Bowl victory 8 more, for a total of 23.9 “weighted” wins.
-----
- Tampa Bay Rays
- Texas Rangers
- Detroit Red Wings
- Los Angeles Lakers
- Boston Celtics
- Pittsburg Penquins
- New England Patriots
- Green Bay Packers
- New York Giants
- Boston Bruins
- Miami Marlins
- Philadelphia Flyers
- San Jose Sharks
- New Jersey Devils
- Washington Capitals
44. Milwaukee Brewers
45. ** New York Rangers **
46. Philadelphia Eagles
[...]
54. New York Jets
55. Dallas Cowboys
[...]
70. Boston Red Sox
71 Colorado Avalanche
[...]
115. Brooklyn Nets
116. NY Knicks
117. Chicago Cubs
118. Toronto Maple Leafs
119. New York Islanders
120. New York Mets
121. Minnesota Timberwolves
122. St. Louis Rams


No comments:
Post a Comment